Credit it. 2023
1.
The view
1 articles
2.
2022 a watershed year
1 articles
3.
The shape of Europe's tech lending market
1 articles
4.
Misperception of risk?
1 articles
5.
Institutional investor outlook
1 articles
6.
About our data partners and GP Bullhound
7.
Disclaimer
Credit it.
2023
This report is intended for professional investors only; see the back of the report for important disclosures. GP Bullhound Corporate Finance Ltd and GP Bullhound Asset Management Limited are authorised and regulated by the Financial Conduct Authority. GP Bullhound Inc is a member of FINRA. GP Bullhound Luxembourg S.À R.L. is regulated by the CSSF in Luxembourg.


step forward
Data partnership with
The view
PARTNER, HEAD OF CREDIT
Olya Klueppel
from gp bullhound
Media headlines on European technology companies were almost uniformly negative in 2022: falling valuations, even bankruptcies. The failure of Silicon Valley Bank in March 2023 has also shaken confidence. However, we firmly believe that another important word to characterise the tech sector is "resilience". Great companies have continued to grow and attract capital, as evidenced by the c.€100bn invested in European tech companies in 2022, higher than in any of the past 10 years except 2021.

As we leave the excesses of the low-interest rate environment behind, at GP Bullhound we argue that technology – from cloud tech to AI, from new vaccines to energy efficiency breakthroughs – will continue to drive the global economy and help us solve many of the issues society faces today.

Capital availability for technology companies changed dramatically in 2022. In many cases, this is positive, as unsustainable and unprofitable business models are no longer being funded. The pivot away from "growth at all costs" is a healthy development that both debt and equity investors should welcome. Debt financing has transformed into an important source of financing for technology companies, another sign of the maturity of the European tech ecosystem.

In last year’s report, we stated that European tech lending was at an inflection point. There was a significant step forward in 2022, as overall issuance has grown and the use cases for borrowers are evolving, with a greater variety of credit instruments now available. Lenders have generally exhibited discipline, and pricing has adjusted to better reflect potential risks. Institutional investors remain positive on private debt as an asset class, and lower observed and predicted default rates for technology and software versus other industries suggest continued allocations. These developments point to the sustained healthy progress for European tech lending.  
Sam Han
ANALYST
the view from gp bullhound
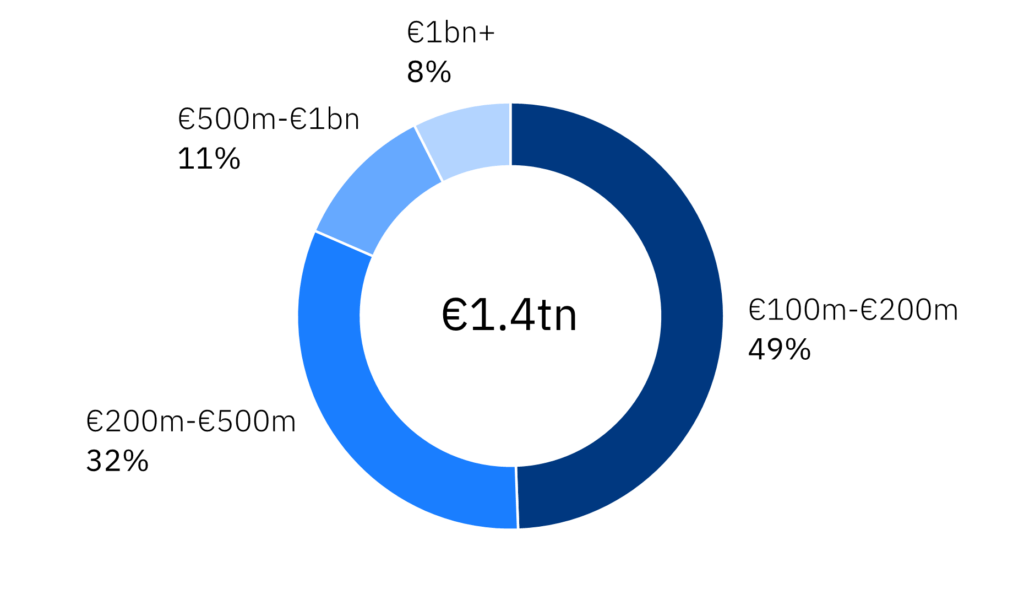
The overall size of the addressable market is still very large. According to Dealroom, there are c. 3,000 technology companies in Europe valued at over €100m. While the overall value of the companies declined by c.50%, reflecting, in particular, the revaluation of later-stage companies in 2022, the absolute size of the market is significant at €1.4tn.   
Key takeaways
Total debt capital invested in European tech doubled YoY to €30bn+ in 2022
€1.4tn addressable market
c.3,000 €100m+ EuropeAn tech companies
The improved risk / return parameters and lender-friendly terms are also attracting institutional investors to the asset class. LPs remain very selective, with a preference for senior secured strategies and for lenders with a track record in the specific sectors.
What's driving tech debt issuance
For borrowers, and particularly late-stage companies, debt financing provides an attractive alternative to raising new equity in today’s challenging fund-raising environment. Given a relatively small proportion of companies – per Dealroom, less than 20% of European tech companies raised equity capital in 2022 – we expect the (delayed) need for capital to be more acute in 2023. Many of the tech companies which have not considered loans previously are doing so today, and recognise several clear advantages of debt, such as not giving up control of the business and transparent easy-to-calculate costs.
Acute need for capital 
Lower valuations create interesting opportunities for the acquirers. We have seen a significant pick-up in M&A activity as companies go bargain shopping. Although rising interest rates make debt capital more expensive, acquisitions, financed by a prudent combination of debt and equity, can be helpful in enhancing profitable growth.
Lower valuations create M&A opportunities
Source: Dealroom
Source: Dealroom
power shift
to lenders
institutional investors continue to allocate 
the view from gp bullhound
2022 proved a record-breaking year, with total debt capital invested in European tech companies doubling versus 2021 and reaching over €30bn1. Last year's report foresaw an increase in absolute lending volume as well as increased penetration of debt as a percentage of total funding. In our 2023 report, we highlight the key trends affecting both borrowers and lenders, the performance of the tech sector over the past few decades as measured by defaults, and institutional investor sentiment. Our outlook for the remainder of 2023 is cautiously positive, with debt issuance by growth-stage technology companies likely to continue at an active pace due to a confluence of several trends.
From a lender's perspective, the market has become significantly more attractive. Debt terms today better reflect the balance of power between borrowers and lenders. Moreover, lender discipline has returned: leverage ratios, however measured, have declined and covenants are no longer viewed as optional. Lenders take time to deliver term sheets and undertake due diligence to understand company fundamentals. "Tourists" – those with limited knowledge of specific sectors or geographic and legal nuances – are largely out. Close relationships between the borrower and lender came to the fore, with borrowers concerned about the certainty of capital, and lenders working with management and owners through good times, by supporting further growth, and the bad, when the numbers are missed.
the view from gp bullhound
Note: 1) Total debt capital 2022 per Dealroom
2022 a watershed year
In Europe, after a very strong start in 2022, the total amount raised by private technology companies declined by 20% versus 2021, a peak year. We would argue, however, that the overall picture is more nuanced. Despite the decline, the close to €100bn raised by European tech companies is almost double the amount raised in 2020 or 2019, and almost three times the amount raised in each of the two years prior to that. Quality European tech companies continue to attract international capital, albeit valuations have adjusted.
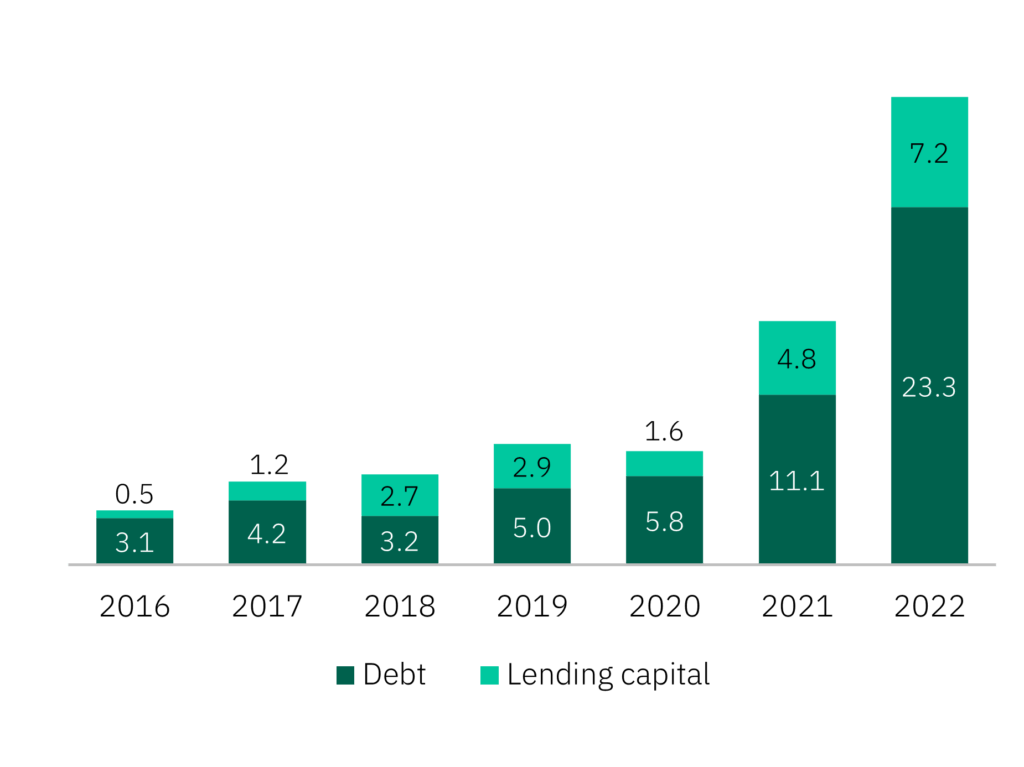
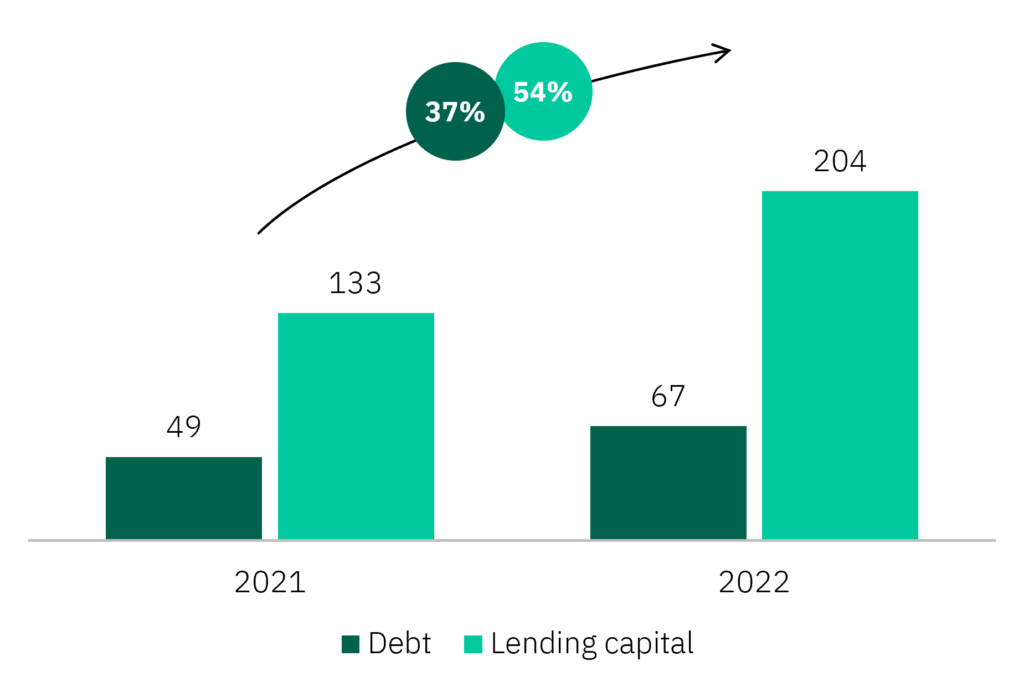
€30.5bn growth debt and lending capital in 2022 - up 2x YoY
Media reporting on public and private technology companies in the past 12 months has been dominated by negative headlines: dramatic declines in valuations, down rounds, and tech lay-offs. The Nasdaq composite index was down by 33% in 2022, and the IPO market was effectively shut in 2022 and in early 2023. Private markets were not spared: the declines in valuations held true across the globe – in the US, Europe, and Asia – even if the underlying reasons were different and the magnitude of declines varied across geographies. Much of the slowdown was concentrated in H2 2022, with growth-stage private companies taking the biggest hit, reflecting the late-stage proximity to public markets and macro volatility.
Banks still dominant, selected LPs going direct
Notably, both the number of companies accessing the debt market as well as the average deal size increased in 2022. Although the average was skewed by several multi-billion debt raises in the energy tech, the median deal size has also increased significantly – €8m in 2022 versus €3m in 2021. Lending facilities – or loans to fintech platforms backed by portfolios of assets such as SME loans, mortgages or hard assets – have seen the same trend: median deal size increased to €150m in 2022 from €95m in 2021, with the average deal size exceeding €200m. By deal count, less than 40 lending facilities were arranged in 2022. 
Definition: Lending capital – loans to fintech and other platforms backed by portfolios of assets such as SME loans, real estate, and other assets. Debt – loans by banks and non-bank lenders directly to companies and including venture debt, growth debt, AR financing, and other forms of loans. 


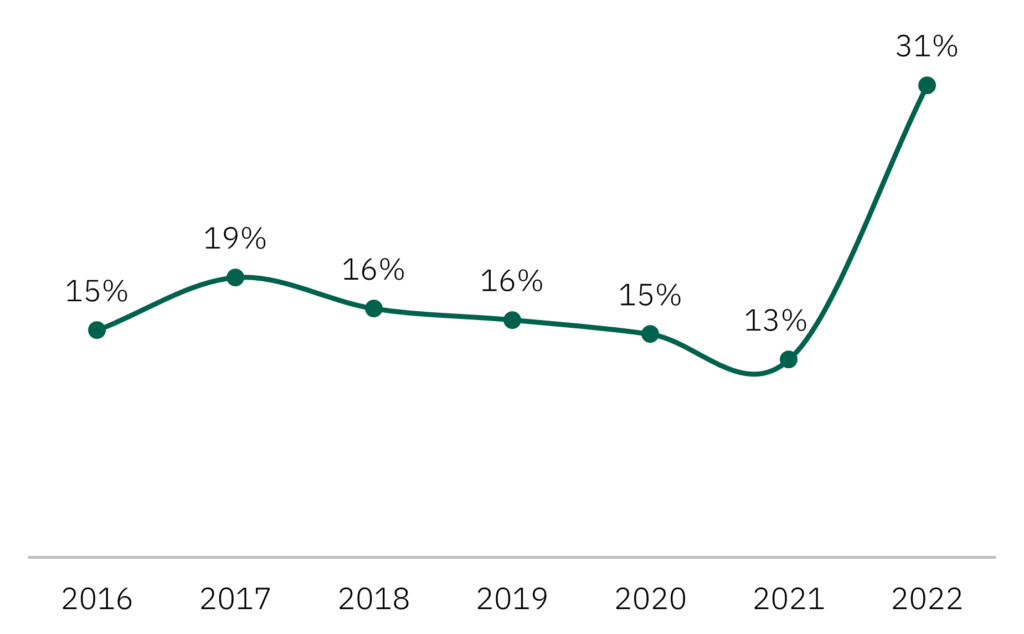
European Debt / VC Funding Ratio
Total Volume of
Tech Lending in europe (€bn)
European Tech Lending by Provider (2022 vs 2021)
In last year’s report, “Credit it. Europe rising”, we expected an increase of debt issuance for technology companies in 2022 but the outcome has surprised even the biggest optimists. Several trends – including the improving quality of the European tech ecosystem, favourable M&A environment from a buyer’s perspective, and the less attractive equity fundraising environment – contributed to debt issuance by European technology companies doubling YoY to €30.5bn in 2022. This is despite 2022 global debt capital markets issuance declining 19% versus the previous year, according to Refinitiv, a global provider of financial market data.
As a result, total debt as a proportion of VC capital raised by European technology companies increased to over 30%. This is a significant departure from the trend which held over the past five years when debt issuance rarely exceeded 15% of the total capital raised.   
Average Deal Size in 2022 VS 2021
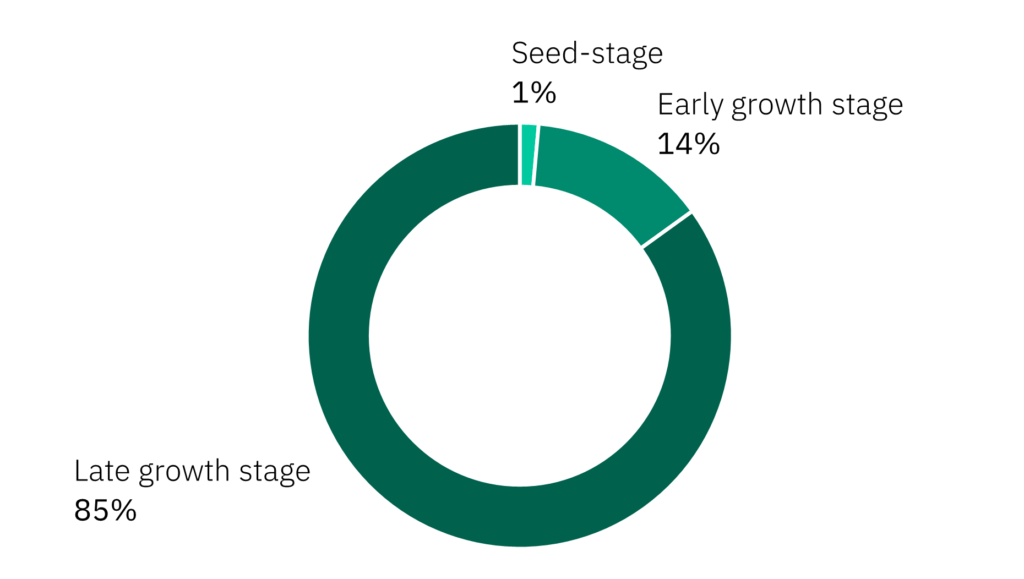
The significant uptick both in the absolute volume as well as the number of deals came despite the increase both in the overall level of interest rates and margin (the latter representing the risk of the borrower) as well as the much lower leverage multiples offered by the lenders. Quality technology assets – those with stable recurring revenues and profitable economics – remain in high demand by lenders. As expected, the vast majority of the debt capital has been raised by late-stage companies. Seed-stage companies normally have neither the revenue nor cash flow stability nor the sufficient assets to obtain debt financing. Only 1% of the amount lent in 2022 went to seed-stage companies. 
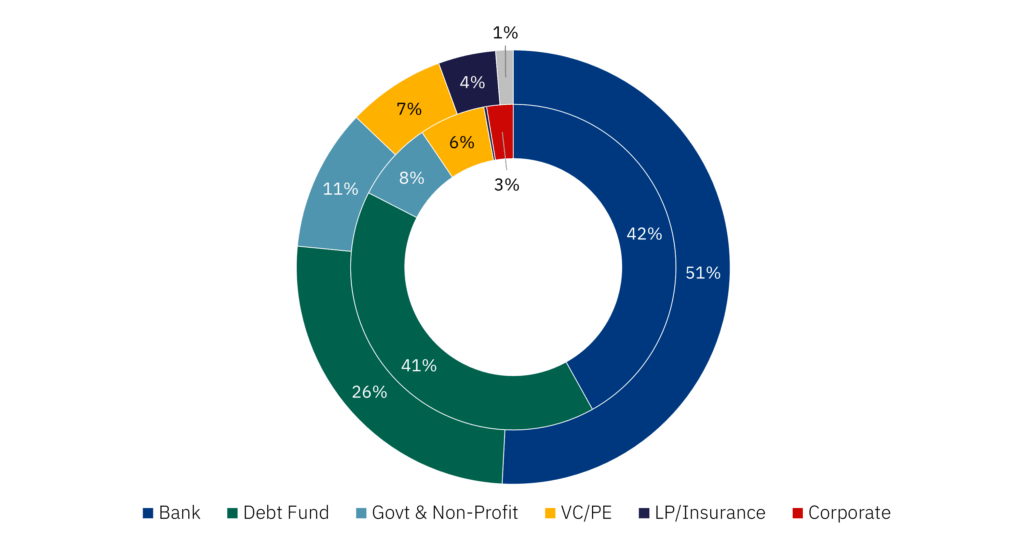
Unlike in the US market, banks remain the dominant providers of loans to technology companies in Europe, and they significantly increased their market share to over 50% in 2022, even in view of the overall debt issuance doubling. Banks, on average, committed more capital, with the average deal size in 2022 at over €60m, double the average deal size for debt funds. 

Data indicates that banks tend to have lower risk appetite and mainly focus on larger borrowers, often as part of a syndicate to spread risk. The cost of capital offered is generally lower versus non-bank lenders, while the approval process takes significantly longer. Anecdotally, for smaller regional banks, a direct relationship with the borrower at times outweighs risk-based pricing and terms. We note that the failure of Silicon Valley Bank in March 2023 is likely to create uncertainty in the near term. 

In contrast, the provision of credit by debt funds declined to approximately a quarter of the market in 2022 versus over 40% in 2021. We believe this is due to a more challenging fundraising environment in Europe, partial withdrawal of non-European players, and overall risk aversion in light of macroeconomic and geopolitical concerns.

The share of government and non-profit institutions has increased markedly, reflecting the continued efforts by specific European governments, as well as EU institutions as a whole, in supporting the tech sector as an important driver of job creation and innovation.

We have also seen the emergence of new players in the market, with institutional investors and, particularly, insurance companies providing loans directly, rather than through investments in debt funds. While the absolute number of such loans is still small, given the average deal size approaching €200m, we believe direct LP participation will remain meaningful going forward. 
Source: Dealroom
Source: Dealroom
Source: Dealroom
Source: Dealroom
Source: Dealroom
Note: Inner circle represents 2021, outer circle represents 2022
Quality European tech companies continue to attract international capital
2022 A WATERSHED YEAR
2022 a watershed year
2022 - Late Stage accounted for 85% of issuance
2022 A WATERSHED YEAR
Expert view
Peter Bialo
Chief Finance Officer, docplanner 
In our particular case we haven’t had to secure new debt in the current environment to support our growth as we closed a sizeable credit facility in the first half of 2022. However, in speaking with other founders, I understand that, for many scale-ups, debt is the only reasonable form of financing available at the moment. The divergence between investors and founders on equity valuations is oftentimes significant, meaning that debt provides a timely workaround until the market improves, or founder expectations fall more in line with public market multiples.

In the past, our main use case for debt financing was M&A, but also for general working capital purposes. Admittedly, we are not actively pursuing M&A at the moment. The reason for this is that we closed three transactions in the past 13 months and are heavily focused on integrating those companies. We spent 2022 investing in tech, go-to-market and support teams, and used the existing credit facility for this purpose. 
"An extra one percentage point in interest is always annoying but it should not affect the strategic outcome for a company. However, a lack of flexibility has the potential to make a detrimental impact."
However, we do have an ear to the ground to stay in tune with the market, and if something very compelling and time sensitive arises, we will not be afraid to execute. While we haven’t been actively reviewing terms in the market, in more informal discussions with our lender we realised that terms have tightened significantly. Interest rates have increased in line with broader market hikes. Discussions around warrant strike prices have become more contentious as historical round valuations may not be reflective of the current market environment.


In terms of factors important to us in evaluating prospective debt financing, flexibility – the ability to use the funds for any reasonable corporate purpose without any major financial covenants – is very important for us. This is a natural feature of equity, and debt should carry this as well in order to be competitive. Our business is quite dynamic: opportunities, such as M&A, may arise unexpectedly. We need to have control over our ability to use debt to fund such initiatives. Flexibility also means a partner will be open to changing terms, like extending repayment periods, without taking advantage of such “asks” (i.e., charging punitive fees). An extra one percentage point in interest fees is always annoying but it should not affect the strategic outcome for the company. However, a lack of flexibility has the potential to make a detrimental impact.
Docplanner is one of the largest online healthcare marketplaces in the world and a leading provider of software solutions for doctors and clinics.
EXPERT VIEW: DOCPLANNER
The shape of Europe's tech lending market
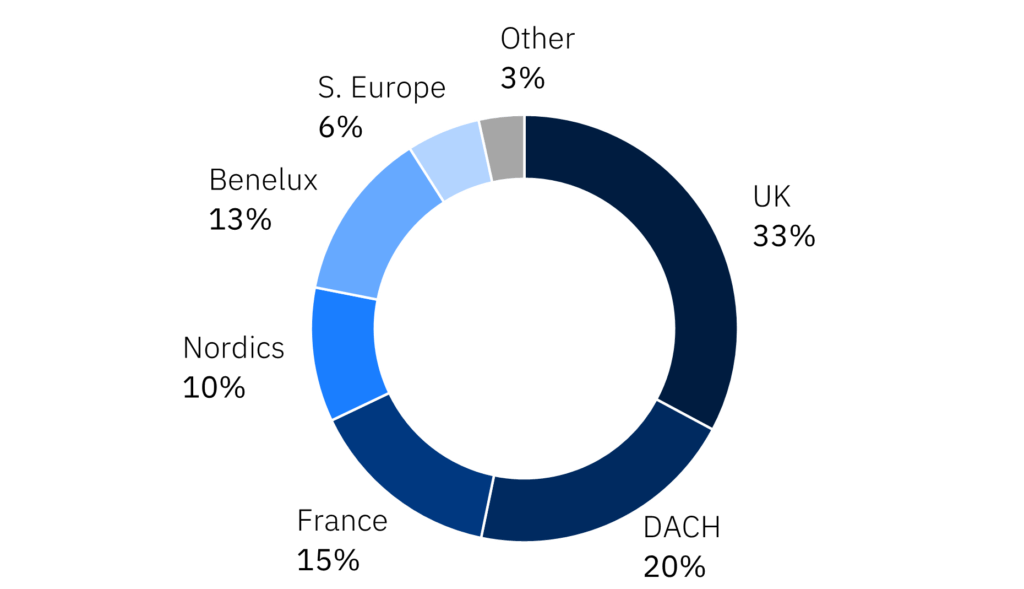
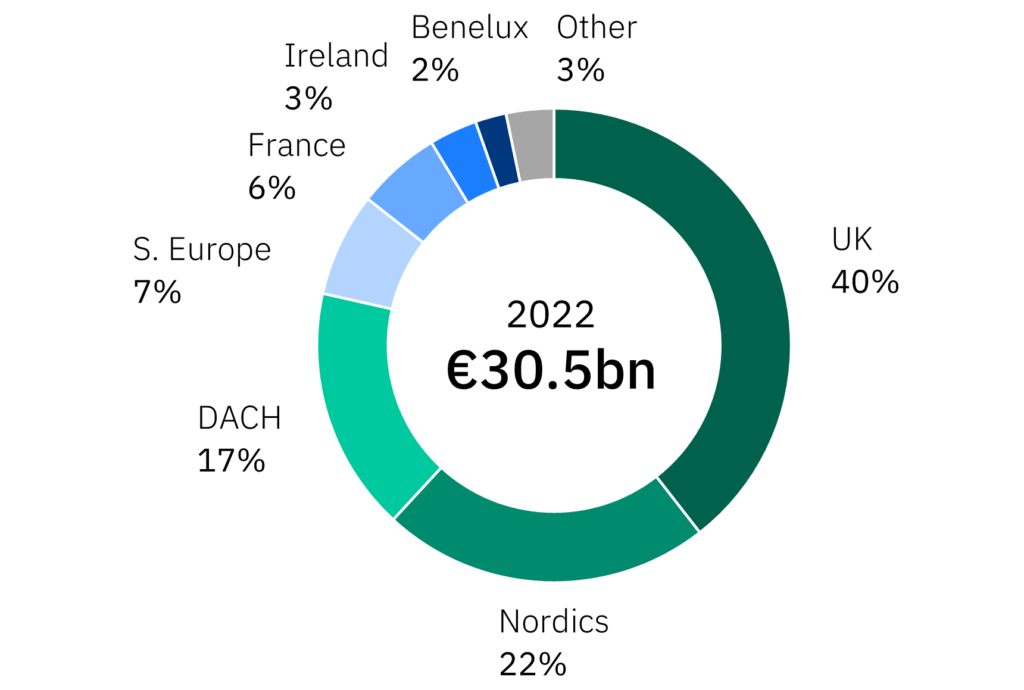
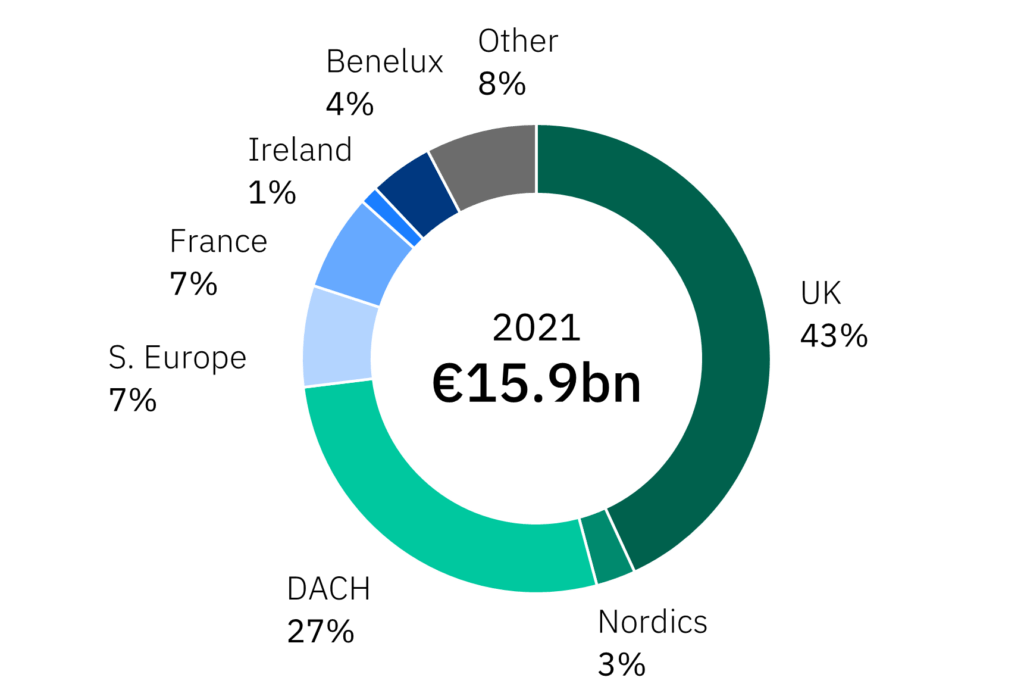
In last year’s report “Credit it. Europe rising”, we highlighted the changing geographic composition as transformative European tech champions are being built across the continent. For this year's report, we worked extensively with Dealroom and the data outlined below show that the dispersion accelerated in 2022: the Nordic region emerged as the second largest, at 22% of the market. This is not surprising given the strong tech cluster in Stockholm, Copenhagen, and the Nordic region as a whole. 

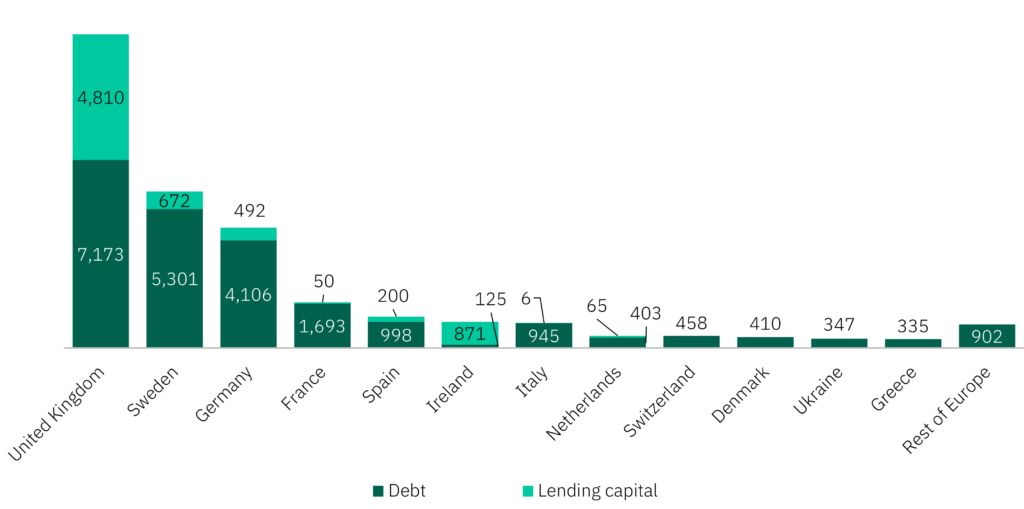
UK technology companies still remain the largest issuers of debt, nearly doubling YoY from €6.8bn in 2021 to €12bn in 2022. However, the proportion declined from 47% in 2016-2021 to 40% in 2022, a significant shift. The UK's leading position is explained by the large number of fintech companies, accounting for c.€4.8bn in lending capital, nearly the size of DACH’s whole tech lending market. Compared to the UK, lending in the DACH region remained relatively flat in absolute terms, from €4.3bn in 2021 to €5.1bn in 2022.

The significant increase in the Nordic market share is partially explained by the €3.5bn debt raise of Swedish company H2 Green Steel in October 2022, which accounted for c.59% of Sweden’s overall debt raised in the past year. Adjusting for this megadeal, we still find that the Nordic market share rose nearly 4x versus 2021, to 11% in 2022. As highlighted in our 2022 report, we expect to see continued redistribution of market share away from DACH and the UK to other regions, in line with maturing tech clusters across the continent.
Significant sectoral shift but fintech dominant 
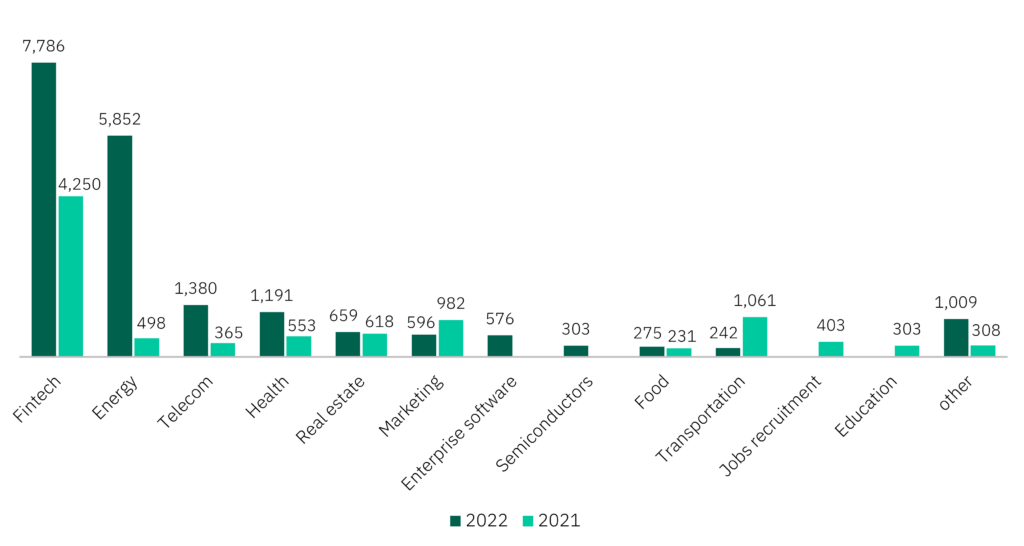
The most notable feature of the tech lending market in 2022 was the significant amount of debt raised by companies seeking to transform the energy sector. Four out of the top 10 largest debt raises in Europe were by companies working on the energy transition and the two biggest raises were by H2 Green Steel (€3.5bn) and Britishvolt (€2bn). Compared to the year prior, energy as a sector multiplied the amount of debt raised by a factor of 12, from c.€0.5bn in 2021 to c.€5.9bn in 2022. This indicates an increasing velocity of capital in Europe backing clean energy and energy storage companies amid the continent’s commitment to leading the global energy transition. H2 Green Steel’s raise financed by a bank syndicate showed a “willingness to support initiatives that will help fulfil the target of the Paris Agreement,” said H2 Green Steel's CEO.

Consistent with last year, fintech accounts for the largest share of the tech lending market and nearly doubled the amount of debt raised from c.€4.3bn in 2021 to c.€7.8bn in 2022. While none of the top 10 debt raises in 2022 were by fintech companies, the sheer volume of debt raises explains their overrepresentation compared to other sectors.
2022 CORPORATE LOANS VS LENDING CAPITAL BY GEOGRAPHY
2022 VS 2021: EUROPEAN TECH LENDING BY GEOGRAPHY
2022 vs 2021: Top 10 sectorS by debt raised
GREATER GEOGRAPHIC DISPERSION and significant shift towards energy
 Source: Dealroom
 Source: Dealroom
Source: Dealroom
Source: Dealroom
the shape of europe's tech lending market
THE SHAPE OF EUROPE'S TECH LENDING MARKET
Venture capital view
Approximately half of the companies in our portfolio have explored alternative financing since the tightening in equity markets in January 2022, with the remainder already obtaining debt from various providers in previous rounds. As a result, most of the portfolio is now either received or currently under advanced discussions with debt providers. In the current challenging environment, we see debt lines, such as venture debt or other instruments, as extremely useful tools to lengthen the runway of our companies in a context where the timeline of the next fundraising, and the ability to raise money with satisfactory conditions, is far from guaranteed.
In the more “mature” portfolio companies, where a new larger growth capital funding round is planned, we would typically look into a mix of (i) new equity, (ii) refinancing/extending bank debt and (iii) alternative forms of venture/hybrid debt. Such a mix provides a good balance of more expensive and dilutive equity on the one hand, and more cost-efficient and scalable working capital on the other. Reducing debt ratios, however, is especially relevant today due to high volatility in the current macroeconomic environment and rising interest rates. We were already guiding our portfolio companies early in 2022 with tools and capital to extend runway and retain healthy investments in R&D. The merits of raising debt today are mainly flexibility and speed. 2022 was a challenging year for various tech entrepreneurs to raise larger sums of equity outside the existing cap table, especially at premium valuations. Hybrid forms of debt like ARR lending, asset-based lending and venture debt can provide an alternative and/or extra source of capital.
Due to declining multiples, equity became more expensive compared to previous years, and more companies have looked at alternative financing options – predominantly debt. In addition to debt often being the cheaper alternative, it allows companies that raised on high equity multiples to further grow into their valuations, fundamentally, without being repriced.
We’ve seen more volatility in B2C-related companies, with ecommerce and ecommerce enablers under most pressure in our current portfolio. As structurally more volatile models, marketplaces and volume/take rates-based models have been the fastest to follow the general market downwards, with contractually committed SaaS models showing more resilience. 
Transactional business models like ecommerce or B2C marketplaces had a tough 2022, following the peak in 2020-2021. Exceptions were segments like business and consumer travel platforms, which outperformed pre-Covid levels in H2 2022, for every stage. Other strong segments post-Covid are climate tech and future-of-work with business models in B2B software subscriptions, licensing or with recurring enterprise transactions. In 2023, things might slow but B2B subscriptions remain a healthy business model for most tech entrepreneurs and are loved by investors. For example, at Endeit we have specific in-house fintech expertise and are bullish on this segment. We also work on embedded finance opportunities within our portfolio firms. Especially together with entrepreneurs and their CFOs who have a deep understanding of their real-time data, which enables them to easily scale their spend up or down, and manage cash flow.

The risk-return expectations have changed rapidly with rising interest rates. Later-stage companies will benefit in 2023 simply because they have more flexibility to reduce costs or diversify between regions, clients and products. However, this won’t work for more capital-intense business models or later-stage companies that cannot show prudent metrics to get to profitability in 12-18 months. Earlier-stage companies are more vulnerable now if margins come under pressure and the cash runway is drastically reduced given the current macroeconomic climate. That’s when VCs are put to the test, and where the right debt partner can make a difference in being flexible on covenants, amortisations or in capitalising interest payments to bridge operational fluctuations. Interestingly, seed-stage funding was least affected in 2022 in terms of funding YoY compared to early- and later-stage. There is still a long-term trend and demand to finance new entrepreneurs. 
Except for the sub-sectors that received significant tailwinds (like energy and climate), we have seen capital-intensive models or hyped models with unclear unit economics being most affected in terms of access to capital. Looking at the fundamental impact, we can see a difference between models addressing what we call tier 1 spend versus others; tier 1 spend being expenses a customer does not cut in a recession or downturn (such as ERP software and HR management systems). In terms of differences based on stages, it is clear that growth-stage funding has essentially dried up and there are only very selective ventures being funded. While there is still plenty of funding available to early-stage companies, we see the willingness of customers to enter trials, POCs and other, decreasing due to tightening budgets.
We’ve never been a “growth at all costs” investor and have always kept a close eye on cash level, opex base, and path to profitability. We’ve taken advantage of the 2023 budgeting exercise to signal very clearly to all of our portfolio companies that this focus will be strengthened in the current context and it has been generally well accepted by founders across the board.
The focus will be reaching operational efficiency. Equity investors and debt providers seek a foreseeable profitability point combined with the highest possible sustainable growth rate. Key metrics for this are, for example, Net Retention, Payback time, YoY ARR growth, ARR per FTE, Burn Multiple, CLV/CAC, and Net Magic Number (=QoQ net new ARR versus prior Q S&M spend). At Endeit we specifically focus on detailed CLV/CAC cohorts and CAC Payback period as a proxy for solid product market fit and accelerated scaling potential with new funding, assuming there is a big enough SAM market size. Our team and entrepreneurial LPs lean on more than 16 years of VC experience in various economic cycles, dealing with volatility, and managing longer-term value-add metrics. We sincerely care for our portfolio companies and founders, hence our typical long-term commitments in funding and board contributions until the exit phase.
We have always focused on business models with attractive unit economics from the beginning or at least with a clear path towards it, and the market sentiment has shifted from growth at any cost to profitability. We see this as a correction/normalisation of the market to a more sustainable level and hence expect to continue observing the same in 2023 and beyond. While ventures do not necessarily need to move towards profitable growth, they should move much closer to profitability to be able to react at any time and have a clear path towards it.
Similar to other equity, we view debt as a useful extension of runway in uncertain times and believe that there has been a very strong uptick in this market over 2022. This uptick has led to heightened competition among providers and generally relaxed terms from what we’ve seen, especially in terms of equity upside (warrants) and debt amortisations.
The terms have not yet materially changed in my experience, relative to increased interest prices. We did see more debt funds last year, which should keep the terms competitive. We help entrepreneurs in comparing debt funds and reviewing terms with the CFOs and help with cash management strategies. We also invested in alternative funding platforms; for example, Floryn. With the structural end to cheap credit and rising interest rates, there will be a credit crunch for companies that cannot sustainably grow towards profitability.
We have seen interest rates rising in line with changes in the base rates. Further, equity warrants seem to be losing importance for debt providers while focusing on tighter controls and covenants.
Do you believe debt helps align incentives for tech companies and their owners, in particular by instilling cash discipline? How would you describe a synergistic relationship between debt and equity to achieve the right capital structure in today's environment?
In addition to providing runway, debt could indeed help instil cash discipline in management teams. That being said, most of our portfolio is now on the more mature side within the venture capital investment spectrum, and – again – we are quite cost-conscious investors. As a result, most of our founding teams already have a cautious approach to spending either by nature or as a result of existing debt lines or board composition, and we have not seen a significant change in their behaviour beyond a questioning – shared with us – on being able to raise in satisfactory conditions over the next 12 months.
A proper balance between debt and equity can be a strong incentive for founding shareholders, management, and VCs to stimulate investment in growth and innovation while building a culture of tight cash management. Ultimately this should benefit both the company and equity holders, assuming the terms of debt were reasonable and flexible along the way. However, raising debt is not for everyone. The stage of the company, product-market fit, and growth roadmap should be quite grown-up and proven to ensure a certain level of visibility in revenue growth. Recurring revenues via SaaS business models or subscription-like marketplaces will benefit most from debt due to better terms and larger-sized tickets. For high-risk or semi-turnaround situations, where equity holders can only do so much, raising venture debt in parallel is also a valid and strong case to share risk and upside with the debt holders. It is, however, more an exceptional case, as equity holders should preferably finance these pivots or turnarounds. The right mix of debt and equity will vary with a company’s specific circumstances. The more debt you take on, the more accurate your prediction of the future and clearer your plans for the capital need to be, or you risk net-net losing capital in the long-term to interest and fees.
A well-functioning business should not need debt to install cash discipline but should have controls and planning in place independent of it. This right ratio and relationship between equity and debt depends on different dimensions. The first one is the business model: for models that require an asset-intensive balance sheet or have high working capital requirements, debt is often the only option to grow to scale. Another dimension is the cost. While it is clearly the cheaper option for the models described above, often debt comes at a similar cost to equity but exposes the business to a more significant risk due to repayment obligations. In all these considerations the stage of the business plays an important role as well, given the risks and costs of debt decrease with increasing reliability on cash flows. 
VC roundtable
VC roundtable
Florian Reichert
Partner & Managing Director
Picus Capital
Martijn  Hamann 
Co-owner & Partner
Endeit Capital
Guillaume Santamaria
Partner
Infravia Capital Partners
ICP
EC
PC
Leading investors assess debt 
PC
EC
IPC
EC
ICP
PC
ICP
EC
PC
ICP
EC
PC
Given the challenging fundraising environment in 2022, have your portfolio companies explored alternative forms of financing? And what are the merits of raising debt today?
VC roundtable
VC roundtable
What sub-sectors/which business models have been most/least affected by the current market environment? Is there a difference between the stage of development of the company?
How do you see the trade-off between growth and profitability and what do you expect going forward in 2023?
Have you seen a significant change in debt terms available to the portfolio companies? What have been the biggest changes?
Misperception of risk?
The sharp sell-off of technology stocks in 2022 has revived the common misconception, perhaps arising out of the dot-com bubble, that the technology sector is a particularly risky asset class. Working closely with S&P Global Market Intelligence, we have looked deeper into whether this is true or not for the sector as a whole by using several S&P Credit tools, including the likelihood of defaults per industry as well as actual observed default rates. S&P’s Credit Analytics models are able to capture the default likelihoods of not just the public-rated universe, but also the largely unrated private companies.

We conclude that the technology sector has exhibited lower actual default rates as well as a significantly lower probability of default versus the broader market. It is a trend we expect to continue through the upcoming cycle. Using S&P’s extensive toolbox of credit analytics data, we have used three different methods to comprehensively analyse default risks of tech as an industry. The first method uses S&P’s CreditPro data to compare the historical observed default rate of the high-tech industry to other industries. The second and third calculate the probability of default in the next 12 months, using both the fundamental financial data of each company (PD Fundamentals) as well as wider market, industry, and sovereign risk (PD Model Market Signals).

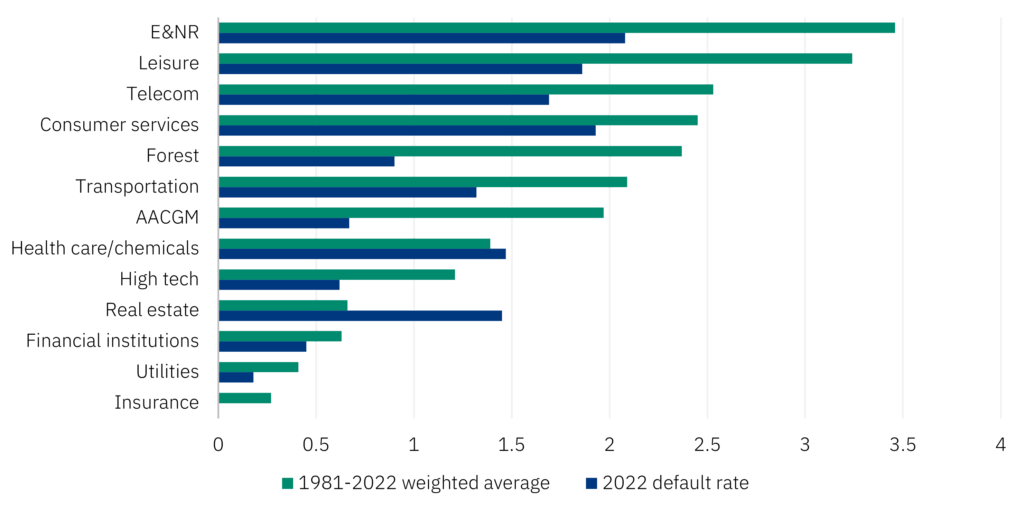
Our findings from all three methods show that the high-tech/software industry has had one of the lowest observed corporate default rates over the last four decades. Using S&P’s CreditPro data, we present the observed corporate default rates by industry for the rated universe of companies for the past four decades. For high-tech, the weighted average was c.1.3% in 1981-2021. Observed default rates are also significantly lower through the two most recent credit crises in 2008-2009 and 2020-2021.
Tech resilient through several credit cycles
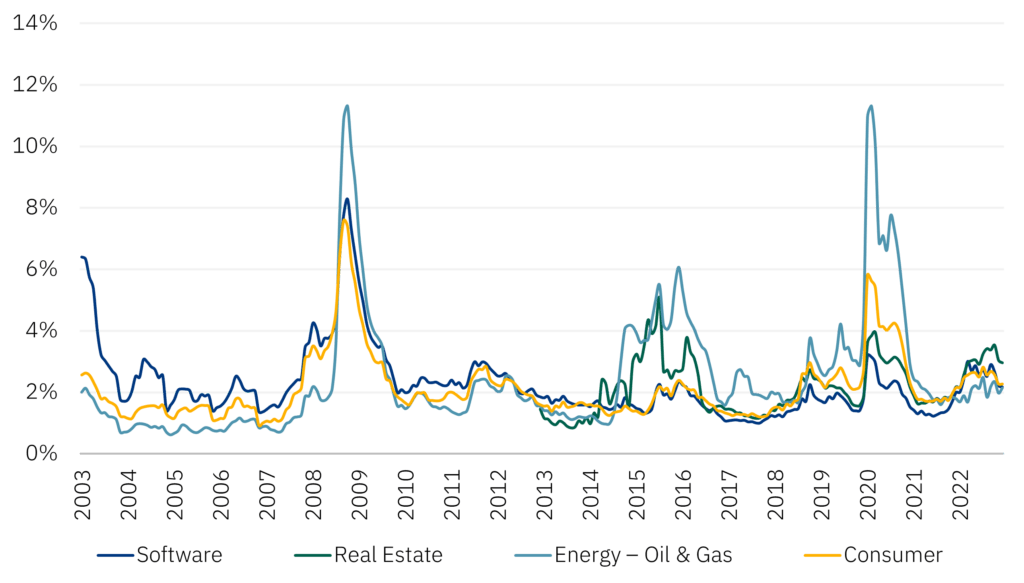
By looking at the probability of default, the tech sector has outperformed compared to other sectors since 2008. This suggests that, on aggregate, tech has become increasingly more resilient through the recent credit cycles as the sector has matured. A more granular look at the historical likelihood of default by industry shows that technology overall, and software in particular, has had increasingly lower probabilities of default. In the last two credit cycles, the Global Financial Crises in 2008-2009 and Covid in 2020, the spread between the stable, relatively low default rates of software companies versus the much riskier industries, like oil & gas or consumer-facing industries, has widened by 150-300 bps. This data suggests that, as we enter a recessionary macro environment with rising interest rates and tighter credit, debt investors should, as always, focus on company fundamentals but also potentially overweight certain business models, like enterprise software, that exhibited lower default rates historically.

S&P’s PD Fundamentals and Market Signals data measure the likelihood of default over the next 12 months (or for longer and shorter periods if required), offering a leading indicator of credit risk. Using S&P’s leading PD Market Signals data, the model below plots the probability of default of various industries since 2003. With tech sectors highlighted in red, we find that post the dot-com bubble the tech industry exhibited probabilities of default of c.5-7% in 2003. However, tech not only recovered through the 2008-2009 credit crisis but its performance relative to other industries improved markedly, with software outperforming more traditional industries, like oil & gas or real estate development. In the 2020-2021 credit crisis, software had a remarkably low probability of default of c.2%. Comparatively, real estate was twice as likely to default compared to tech at c.4%, the consumer-facing goods sector was 3x at 6%, and oil & gas was 5.5x at c.11% at their peaks. 
S&P Probability-of-Default Model Market Signals
As investors consider their credit allocations today, our findings suggest that they should continue allocating to technology among other resilient asset classes that have shown a historically low rate of default. This is further supported by a large addressable market in Europe, with c.3,000 growth-stage tech companies valued at €100m+, allowing the lenders to be more selective. The overall better investment terms available to lenders today, including higher all-in IRR, lower leverage, and tighter covenants – will further benefit investors in the asset class.
Sources: S&P Global Market Intelligence, PD Model Market Signals as of 9 March 2023. For illustrative purposes only
Note: Software includes Application Software and Systems Software; Real Estate includes Real Estate Development, Real Estate Operating Companies, Real Estate Services; Energy – Oil & Gas includes Oil & Gas Drilling, Oil & Gas Equipment & Services, Oil & Gas Exploration & Production, Oil & Gas Refining & Marketing, Oil & Gas Storage, Transportation; and Consumer includes Apparel, Accessories & Luxury Goods, Movies & Entertainment, Packaged Foods & Meats, Soft Drinks. PD Model Fundamentals looks at financial risk and business risk to measure the likelihood of default for millions of public and private banks, corporations, and REITS over one- to 35-year time horizons (As of March 2020). PD Model Market Signals provides a point-in-time view of credit risk for public companies based on a sophisticated model that uses stock price movements and asset volatility, providing signs of potential default for more than 85,000 public companies.
Sources: S&P Global Ratings Research and S&P Global Market Intelligence's CreditPro® Copyright © 2022 by Standard & Poor's Financial Services LLC. All rights reserved. 
Note: High tech includes high technology, computers, and office equipment; AACGM includes aerospace, automotive, capital goods, and metals; Forest includes forest and building products and homebuilders; and E&NR includes energy and natural resources  
Technology sector exhibits lower default rates
misperception of risk
Global corporate default rates by industry
2021 vs long-term average  
Since its inception in 2005, Aquiline has invested around one-third of its capital in Europe through its private equity and venture strategies – across our core sectors of financial services, tech-enabled services, and software/technology. As such, expanding our credit business from the US to Europe was always part of the plan. As we grow our credit team, we expect that 2023 will be a milestone year for Aquiline in Europe. The macro dynamics of rising interest rates, inflation, and equity market volatility will lead to opportunities in Europe just as they have in the US.
Across both regions, fast-growing businesses are demanding creative financing solutions. Aquiline continues to meet teams and companies who are seeking funding outside of what traditional equity and senior lending markets can provide. This points to one key difference between the US and Europe: alternative sources of financing. While the US has developed a robust advisory and middle market private credit community, we continue to find companies underserved in Europe. Europe is a white wide-open space when it comes to lending for fast-growing businesses.


"Fast-growing businesses are demanding creative financing solutions. The US has developed a robust advisory and middle market private credit community."
Structural differences between the regions have created some variations between the technology companies in each market. In payments, for example, Europe has often led the way in consumer innovations including chip-and-PIN and contactless payments. Conversely, the US has broadly been ahead in public and private cloud adoption due to US leadership in cloud infrastructure by the “big 3”: Microsoft, Amazon, and Google. The ability to understand these dynamics and nuances is key to developing successful investment theses in Europe.
 "We anticipate continued interest in the current environment in mission-critical sectors like technology and capital-light financial services." 
When we compare debt terms between the regions, we tend to see smaller situations in Europe, and more non-sponsored situations. There, creative structuring is incredibly important. We strive to develop specific themes and provide the best solution we can based on a company’s needs. Thus, the terms of our investments will vary between deals in Europe as much as in the US.

In contrast to the US, Europe tends to have fewer dedicated funds focused on the venture and growth debt segments of the private credit markets, so the market is more concentrated across a few banks and a handful of funds. Both the US and European markets have become increasingly competitive. Velocity and volume are increasing in both markets given the decline in equity valuations and companies wanting to emphasise liquidity buffers with a more uncertain macro backdrop.
In the current environment, Aquiline anticipates continued lending interest in Europe for mission-critical sectors like technology and capital-light financial services, particularly as we navigate macroeconomic uncertainty that can make more cyclical sectors harder to evaluate.
Aquiline provides private capital to founders and entrepreneurs in financial services and technology.
Expert view
timothy gravely
partner, head of credit opportunities | aquiline 
credit it. 2023
expert view: aquiline
Institutional investors
stable allocations to private debt   
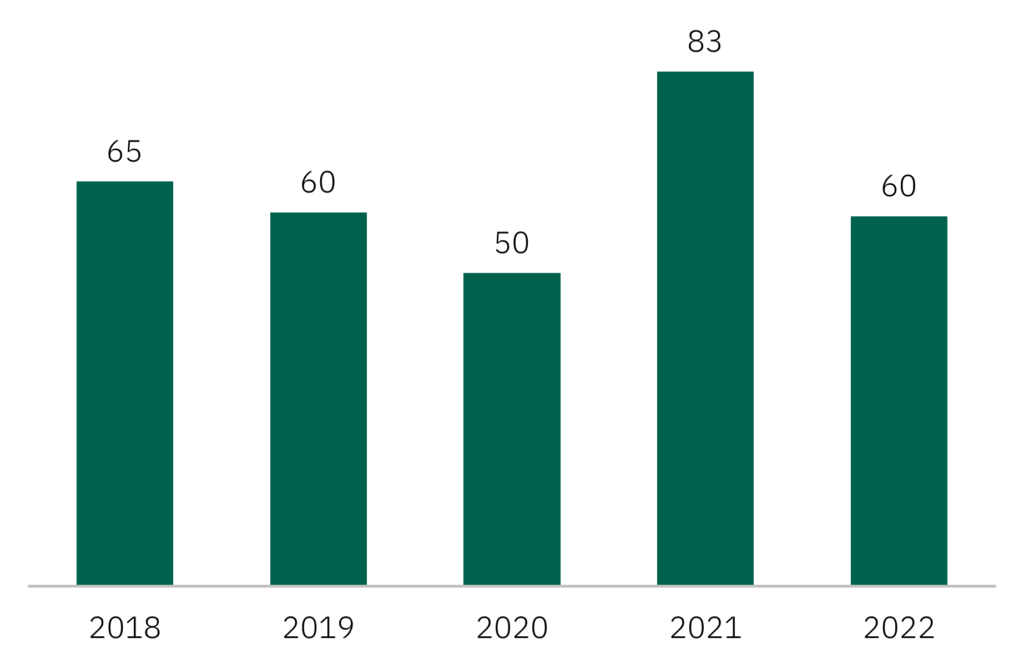
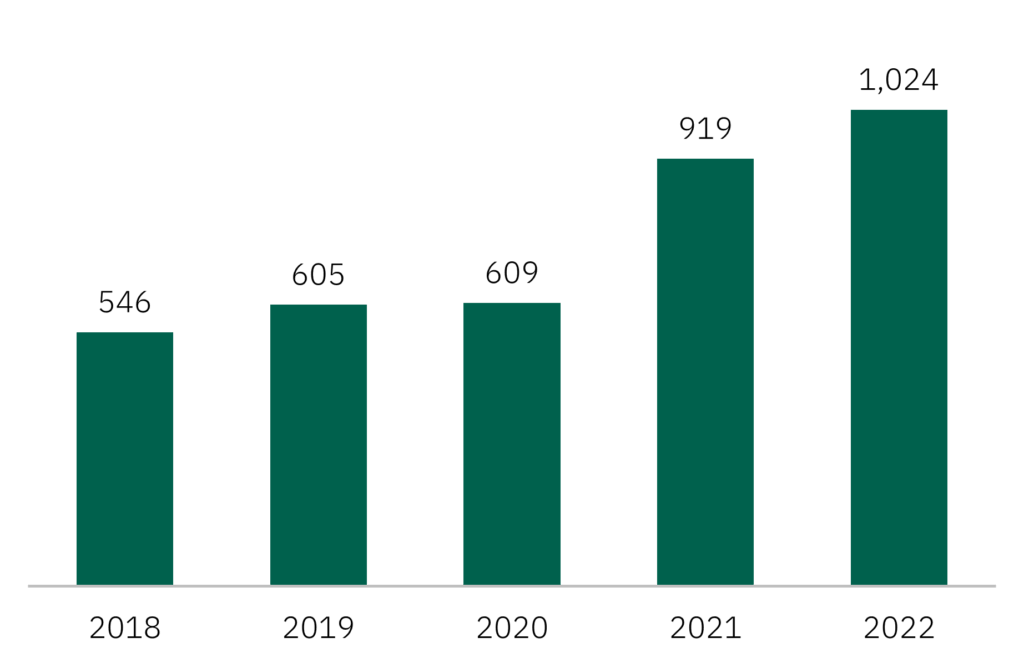
We have seen an increasing concentration of capital, as illustrated both in terms of surging average fund size as well as the majority of LP capital flowing to an ever-smaller number of managers. Globally, the average fund size rose above €1bn. For European-focused funds, the average fund size doubled between 2018 and 2022 from c.€600m to €1.4bn. Further, the proportion of capital raised by the 10 largest private debt funds peaked at 31% in 2021 from 20% just three years prior.   


European-focused
private debt fundraising (€bn)
Average fund size globally (€m)
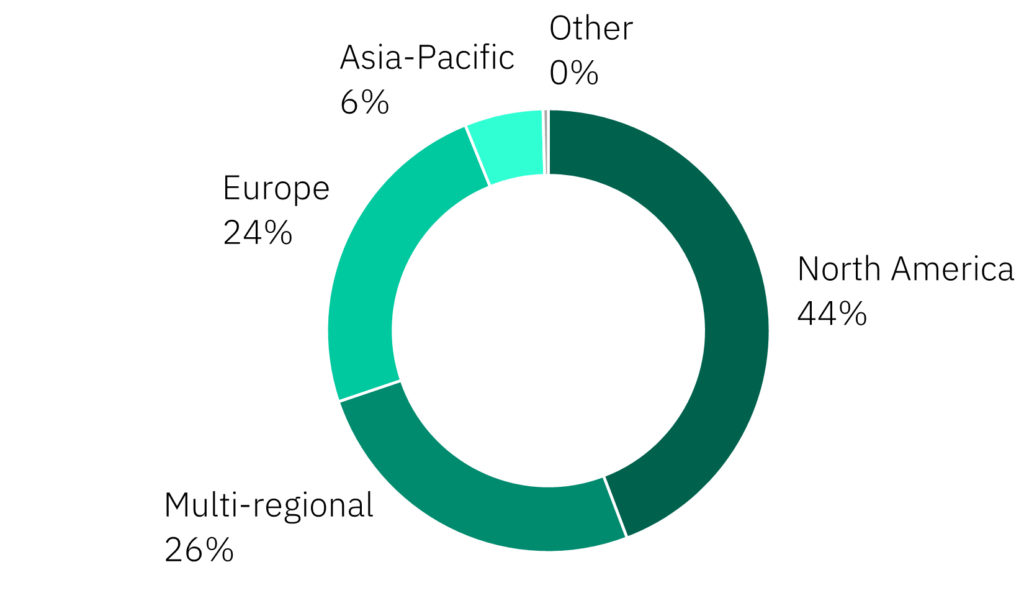
An interesting trend has been the decline in allocations towards multi-regional funds, the vast majority of which focused on developed markets in the US and Europe: the proportion declined from 37.7% in 2019 to under 27% in 2022. In addition to geopolitical and macroeconomic considerations, many investment funds, and ultimately also LPs, realised that to be successful in a specific geography one has to have “feet on the ground” as well as a deep understanding of local legal, cultural, and insolvency factors. Sourcing quality German deals while sitting in New York, or an Ohio transaction from  Frankfurt, does not often work in practice.
As an increasing number of technology companies turn towards debt to finance both organic and inorganic growth, understanding the sentiment towards this asset class among the ultimate providers of capital, institutional investors, is important. We worked extensively with news and analysis platform Private Debt Investor, and the data outlined below shows that global private debt fundraising continues at a strong pace. Although the overall amount of capital raised by private debt funds declined by 14%, it was 2021 that was an outlier. Capital raised in 2022 was higher versus each of the years between 2018 and 2020.

 
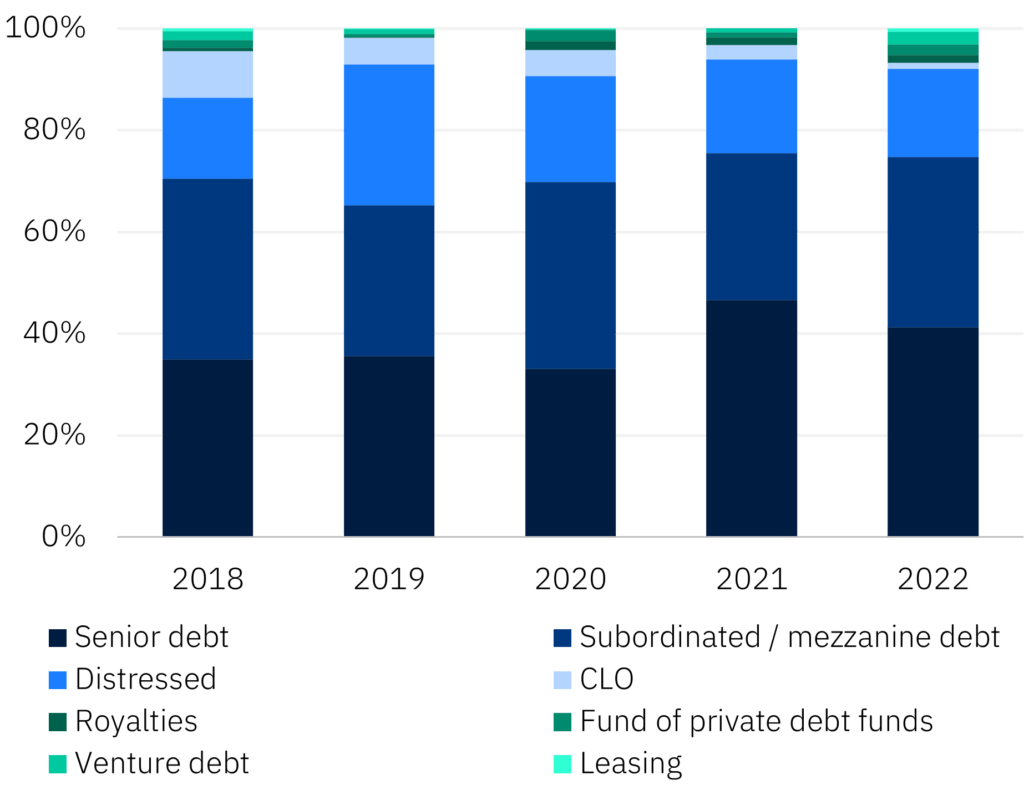
What credit strategies do institutional investors favour today? There has been an increasing interest in senior debt strategies, with a proportion of capital raised increasing to above 40% over the past two years. A similar trend can be seen in the number of funds raised. The preference for security and lower proportion of subordinated and distressed funds is consistent with the concerns about the health of the businesses in an inflationary and potentially recessionary environment. Another factor is the much higher all-in returns offered by senior debt funds today versus 6-12 months ago as central banks have raised interest rates globally while credit spreads widened.  

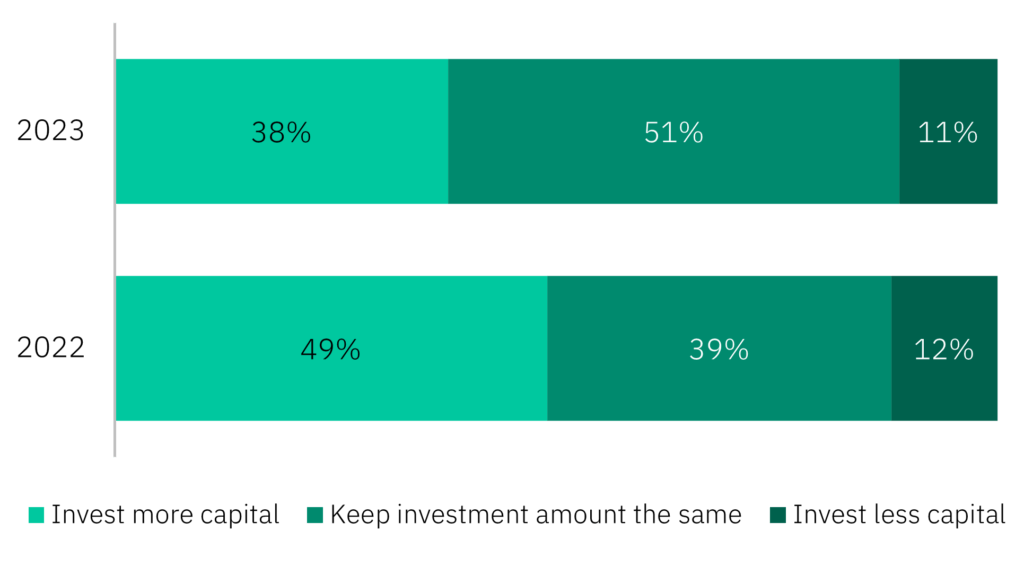
Based on the Private Debt Investor LP Perspectives Survey, the overall amount of capital dedicated to private debt is expected to increase, albeit at lower growth rates versus recently, with over three times as many LPs planning to increase allocations to private debt versus those planning to decrease.
Institutional investors generally positive on debt 
2022: Capital raised by region 
Strategy Focus of Private Debt FUNDS 
by € raised
LP Investments in Private Debt
NTM vs LTM
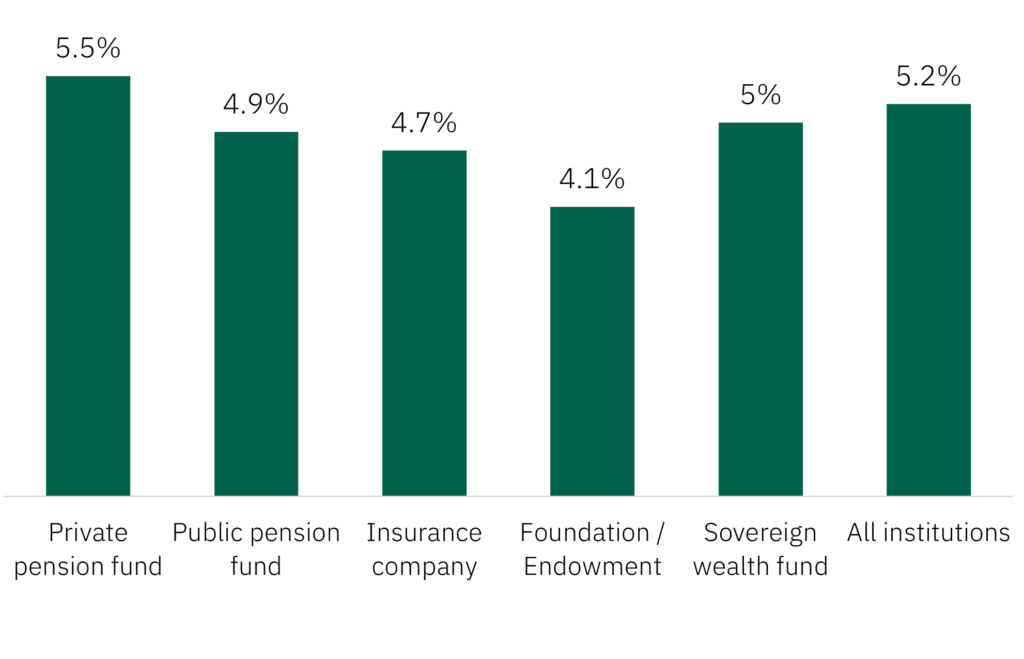
This data should be placed in the context of the overall relatively low allocations towards private debt by main categories of institutional investors. Such allocations vary between 4% and 6%. For comparison, average allocations to private equity across all LP types reached double digits in 2022, according to data by Private Debt Investor. We expect this percentage to increase, with certain LPs increasingly investing directly.
Average private debt exposure
by institution type (%) 
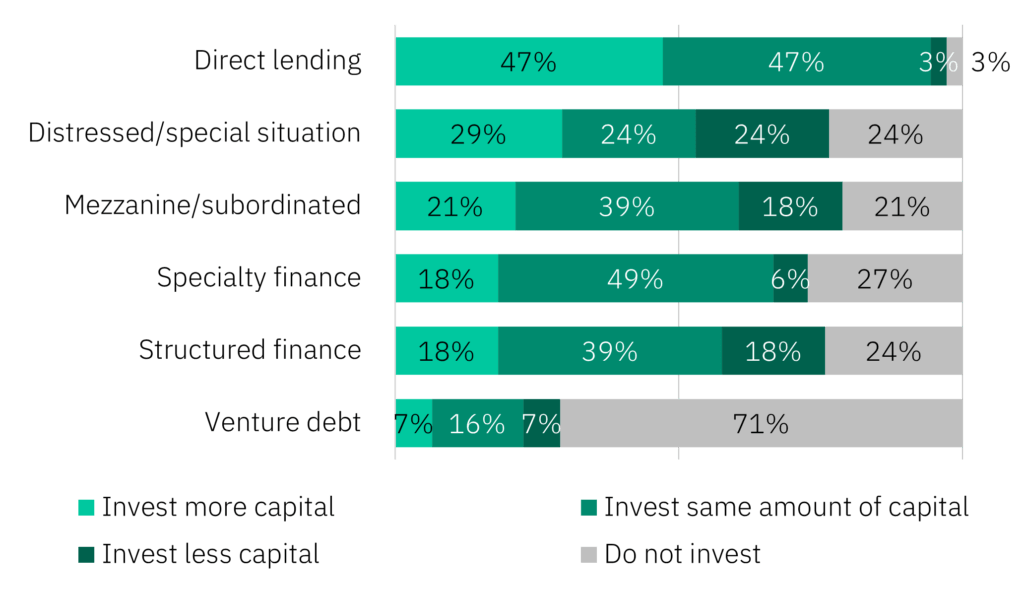
Direct lending (corporate loans to private companies, usually SMEs, made by private debt funds) dominates LP allocations, with interest in the strategy likely to continue. On the other side of the spectrum, venture debt (lending to early-stage, VC-backed companies in combination with an equity round) is a relatively young strategy, with less than a quarter of institutional investors planning to allocate to the strategy.
LP investments in private debt strategies
NTM vs LTM
While we expect continued interested in private debt, with senior direct lending strategies in focus, we believe pressure from LPs will ultimately lead private debt funds to become more selective regarding which technology companies to back, with increased focus on profitable and sustainable business models. It will be specialists – lenders that have a deep understanding of specific sectors and access to the best companies built through long-term relationships – who will benefit in the current market environment.   
We believe there are multiple reasons behind this trend. A key component is that absolute volume of allocations of large institutional investors simply cannot accommodate smaller fund sizes without running into diversification issues. There are clear benefits of diversification. At the same time, some sophisticated investors have long recognised that smaller specialists often offer better risk-adjusted returns versus large generalist funds. Additionally, larger funds have been perceived as safer due to larger deal sizes (and thus investments in correspondingly larger companies). However, larger deal size does not necessarily imply a safety margin as weak covenants, high leverage ratios and significant adjustments to the EBITDA definition, together with normally weak relationships between the lenders and the borrowers, in syndications particularly, may negate any such benefits. 
Source: Private Debt Investor
Source: Private Debt Investor
Source: Private Debt Investor
institutional investors
Allocations to European-focused private debt funds showed a significant slowdown last year. Total capital raised in 2022 was down 28% versus 2021 and was also lower than the amounts raised in both 2019 and 2018. The impact of the war in Ukraine, the first large-scale conflict on European soil in 80 years, combined with the concerns about the macroeconomic and inflationary impact on the continent played a significant role.
How much capital do you plan to invest in private debt NTM versus LTM?
Regarding private debt, how do you plan to invest in the following fund strategies NTM versus LTM?
Over the last 50 years, the global economy has seen a significant shift to an asset base comprising mostly of intangible assets. We are in an innovation-driven economy: intellectual property (IP) enables innovation to be transformed into valuable assets. As a result, the market value of intangible assets has increased by an impressive 255% since 2009, while the book value of tangible assets has only grown by 97%. The rise of IP encourages companies to take better care of this increasingly important asset as well as creates opportunities for lenders. Within Aon we have developed advanced IP analytics and proprietary methodologies based on AI and ML to value IP and assist companies to monetise and protect IP as an asset.


“The market value of intangible assets has increased by an 255% since 2009, while the book value of tangible assets has only grown by 97%.”
Intellectual property refers to the creation of the mind. With increased IP filings globally and companies ready to enforce their IP, companies with a focus on innovation should explore IP insurance to protect their investment. Globally IP litigation is increasing and becoming more profitable. It can be catastrophic to even the strongest of balance sheets: IP complexity leads to expert lawyers and lengthy trials resulting in eye-watering legal fees, with the highest cost being damages and settlements, often in the hundreds of millions. The IP liability insurance policy pays for defensive legal expenses, settlements, and damages in the event of an allegation of infringement or trade secret misappropriation from both competitors and non-practising entities (patent trolls).  
The insurance is underwritten on financials, industry, and claims history. To obtain the most competitive insurance terms, detailing IP governance can lead to a more favourable outcome. Some important questions are: What intellectual property does the business own? Does it conduct a Freedom to Operate? Is it part of any network focused on reducing the number of non-practising entity assertions? And is the company indemnified for IP infringement by its suppliers? The policy will cover all types of IP for infringement, such as patents, trademarks, copyright, design rights, and trade secrets.
“IP litigation is increasing and becoming more profitable. It can be catastrophic to even the strongest of balance sheets.”
Traditional lenders struggle to finance IP-rich companies as they rarely have the tools to accurately assess the value of such assets. This in turn makes it difficult for growth-stage companies to access the growth capital they need. Given the potential economic downturn and tightening of equity markets, businesses are now more than ever in need of alternative financing solutions.

To solve this challenge, Aon has built an IP-backed lending solution by using insurance to enable debt transactions using IP as collateral. Aon is responsible for placing the insurance and the IP valuation carried out on behalf of insurers to get them comfortable with IP value (the collateral). Aon provides a valuation of IP by applying a qualitative and quantitative review of the IP using a proprietary analytics platform. The valuation is provided on behalf of insurers who then provide an insurance wrap known as Collateral Protection Insurance. This insurance crystalises the value of a borrower’s IP assets and provides lenders with protection against the devaluation of IP assets in the event of a default.

For the qualitative valuation, Aon uses proprietary data analytics to generate a view of the value of an IP portfolio around the scope of claims coverage, market opportunities, and risk factors associated with the portfolio. For the quantitative, Aon applies different methodologies, including market, cost, and income approaches, to value intellectual property to address the market dynamics of the contemplated transaction, including liquidation to going-concern settings. To avoid a conflict of interest, valuation and IP broking are kept separate. 
Aon is a multinational financial services firm that sells a range of risk-mitigation products, including Commercial Risk, Investment, Wealth, Health and Reinsurance solutions.
IP INSURANCE
IP BACKED-LENDING
Growth companies should focus on prioritising their IP governance. IP comes in different forms such as patents, trademarks, copyright, and trade secrets. Recognising and valuing each is important for various reasons: (i) value creation, (ii) monetisation, and (iii) protection of asset value. Filing IP can offer companies a wide range of opportunities for value creation. Not only does filing IP unlock potential revenue streams through licensing, but it also makes it possible to monetise the asset by selling it if necessary.
Expert view
henry coates
associate director | aon
expert view: aon
expert view: aon
S&P Global Market Intelligence is a division of S&P Global (NYSE: SPGI). S&P Global is the world’s foremost provider of credit ratings, benchmarks, analytics, and workflow solutions in the global capital, commodity, and automotive markets. With every one of our offerings, we help many of the world’s leading organisations navigate the economic landscape so they can plan for tomorrow, today.
Private Debt Investor is the publication of record for the world’s private credit markets. It is written expressly for the providers and users of debt for private assets. The publication tracks the institutions, the funds and the transactions shaping the private debt markets.
We thank Dealroom.co, Standard & Poor's, Private Debt Investor, and our interviewees for their time, data and insights. Learn more about the data providers featured in our report below.
Dealroom.co is the foremost data provider on startups, growth companies and tech ecosystems in Europe and around the globe. Founded in Amsterdam in 2013, Dealroom.co now works with many of the world's most prominent investors, entrepreneurs and government organisations to provide transparency, analysis and insights on startups and venture capital activity.
Featured in our report 
About GP Bullhound
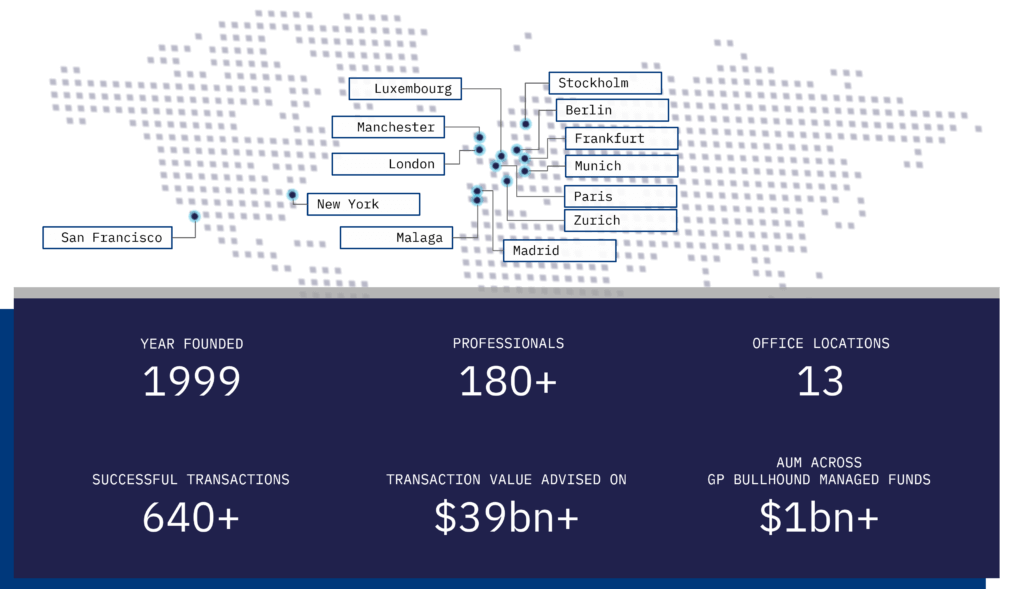
GP Bullhound is a leading technology advisory and investment firm, providing transaction advice and capital to the world's entrepreneurs and founders. Founded in 1999 in London and Menlo Park, the firm today has 13 offices spanning Europe, the US and Asia. For more information, please visit www.gpbullhound.com.
GP Bullhound partners with entrepreneurs throughout their founding journey, supporting them with advisory, capital, insights and access to our global network.
gp bullhound
Disclaimer
No information set out or referred to in this communication shall form the basis of any contract. The issue of this insights report (the “report”) shall not be deemed to be any form of binding offer or commitment on the part of GP Bullhound or any of its affiliates or subsidiaries. This report is provided for use by the intended recipient for information purposes only. It is prepared on the basis that the recipients are sophisticated investors (so-called “professional clients” in the meaning of Annex II of Directive 2014/65/EU on markets in financial instruments, or their equivalent elsewhere) with a high degree of financial sophistication and knowledge. This report and any of its information is not intended for use by private or retail investors in the EU, the UK or any other jurisdiction where access, use or availability of this information would be unlawful.​ ​

This report does not provide personalized advice or recommendations of any kind. You, as the recipient of this report, acknowledge and agree that no person has nor is held out as having any authority to give any statement, warranty, representation, or undertaking on behalf of GP Bullhound in connection with the contents of this communication. Although the information contained in this report has been prepared in good faith, no representation or warranty, express or implied, is or will be made and no responsibility or liability is or will be accepted by GP Bullhound. In particular, but without prejudice to the generality of the foregoing, no representation or warranty is given as to the accuracy, completeness or reasonableness of any projections, targets, estimates or forecasts contained in this report or in such other written or oral information that may be provided by GP Bullhound. The information in this report may be subject to change at any time without notice.​ ​

GP Bullhound is under no obligation to provide you with any such updated information. All liability is expressly excluded to the fullest extent permitted by law. Without prejudice to the generality of the foregoing, no party shall have any claim for innocent or negligent misrepresentation based upon any statement in this report or any representation made in relation thereto. Liability (if it would otherwise but for this paragraph have arisen) for death or personal injury caused by the negligence (as defined in Section 65 of the Consumer Rights Act 2015) of GP Bullhound, or any of its respective affiliates, agents or employees, is not hereby excluded nor is damage caused by their fraud or fraudulent misrepresentation.​ ​

This report should not be construed in any circumstances as an offer to sell or solicitation of any offer to buy any security or other financial instrument, nor shall they, or the fact of the distribution, form the basis of, or be relied upon in connection with, any contract relating to such action. The information contained in this report has no regard for the specific investment objectives, financial situation or needs of any specific entity and is not a personal recommendation to anyone. Persons reading this report should make their own investment decisions based upon their own financial objectives and financial resources and, if in any doubt, should seek advice from an investment advisor. Past performance of securities is not a guide to future performance and the value of securities may fall as well as rise. In particular, investments in the technology sector may be subject to frequent fluctuations. The information contained in this report is based on materials and sources that are believed to be reliable; however, they have not been independently verified and are not guaranteed as being accurate. The information contained in this report is not intended to be a complete statement or summary of any securities, markets, reports or developments referred to herein.

​ ​ This report may contain forward-looking statements, which involve risks and uncertainties. Forward-looking information is provided for illustrative purposes only and is not intended to serve as, and must not be relied upon as a guarantee, an assurance, a prediction or a definitive statement of fact or probability. Actual events and circumstances are difficult or impossible to predict and may differ from assumptions. 

Any and all opinions expressed are current opinions as of the date appearing on the documents included in this report. The information contained in this report should not be relied upon as being an independent or impartial view of the subject matter, and for the purposes of the rules and guidance of the Financial Conduct Authority (“the FCA”) and of the Financial Industry Regulatory Authority (“FINRA”), and of the Commission de Surveillance (du Secteur Financier “CSSF”), this report shall not be viewed as a research report and is considered marketing communication and a financial promotion. 
Thus, in accordance with COBS 12.2.18 of the FCA Handbook, its contents have not been prepared in accordance with legal requirements designed to​​ promote the independence of investment research and it is not subject to any prohibition on dealing ahead of the dissemination of the report.

The individuals who prepared the information contained in this report may be involved in providing other financial services to the company or companies referenced in this report or to other companies who might be said to be competitors of the company or companies referenced in this report. GP Bullhound, through its investment banking and asset management departments, does and seek to do business with companies which are, or may be covered in this report. As a result, both GP Bullhound and the individual members, directors, officers and/ or employees who prepared the information contained in this report may have responsibilities that conflict with the interests of the persons who access this report.​

GP Bullhound and/or connected persons may, from time to time, have positions in and/ or effect transactions in any investment or related investment mentioned in this report and may provide financial services to the issuers of such investments. The information contained in this report or any copy of part thereof should not be accessed by a person in any jurisdictions where its access may be restricted by law and persons into whose possession the information in this report comes should inform themselves about, and observe, any such restrictions. Access of the information contained in this report in any such jurisdictions may constitute a violation of UK or US securities law, or the law of any such other jurisdictions. Neither the whole nor any part of the information contained in this report may be duplicated in any form or by any means. Neither should the information contained in this report, or any part thereof, be redistributed or disclosed to anyone without the prior consent of GP Bullhound. GP Bullhound and/or its associated undertakings may from time to-time provide investment advice or other services to or solicit such business from any of the companies referred to in the information contained in this report. 

​ Accordingly, information may be available to GP Bullhound that is not reflected in this material and GP Bullhound may have acted upon or used the information prior to or immediately following its publication. However, no person at GP Bullhound (which includes its members, directors, officers and/or employees), may undertake personal transactions in financial instruments of companies to which this report relates, without receiving prior clearance from the GP Bullhound Compliance Officer or nominated delegated. In addition, GP Bullhound, the members, directors, officers and/or employees thereof and/or any connected persons may have an interest in the securities, warrants, futures, options, derivatives or other financial instrument of any of the companies referred to in this report and may from time-to-time add or dispose of such interests. GP Bullhound Corporate Finance Ltd and GP Bullhound Asset Management Ltd are private limited companies registered in England and Wales, registered numbers 08879134 and 08869750 respectively, and are authorised and regulated by the Financial Conduct Authority. GP Bullhound Luxembourg Sarl is a private limited company, registered in Luxembourg (B-254.845) and authorized and regulated as an Alternative Fund Manager by the CSSF in Luxembourg (A00003217). Any reference to a partner in relation to GP Bullhound is to a member of GP Bullhound or an employee with equivalent standing and qualifications. A list of the members of GP Bullhound is available for inspection at its registered office, GP Bullhound 78 St. James's Street, London SW1A 1JB.​​

For US Persons: This report is distributed to US persons by GP Bullhound Inc. a broker-dealer registered with the SEC and a member of the FINRA. GP Bullhound Inc. is an affiliate of GP Bullhound Corporate Finance Ltd. All investments bear certain material risks that should be considered in consultation with an investors financial, legal and tax advisors. GP Bullhound Inc. engages in private placement and mergers and acquisitions advisory activities with clients and counterparties in the Technology and CleanTech sectors.

In addition, the persons involved in the production of this report certify that no part of their compensation was, or will be, directly or indirectly related to the specific views expressed in this report. As such, no person at GP Bullhound (including its members, directors, officers and/or employees) has received, or is authorized to accept, any inducement, whether monetary or in whatsoever form, in counterparty of promise to issue favorable coverage for the companies to which this report may relate.
disclaimer
disclaimer